0%
MON-FRI: 10:00AM - 09:00PM

Energy Meter Management System (IoT Enabled)

Transform your facility into an energy-efficient smart factory with our IoT-Based Energy Meter Management System. Monitor electricity consumption across plants, production lines, departments, machines, utilities, and buildings in real time from a centralized dashboard. Designed for Manufacturing Industries, Automotive, Engineering, Pharmaceuticals, FMCG, Food Processing, Textile, Chemicals, Commercial Buildings, Hospitals, and Smart Campuses.

Monitor • Analyze • Optimize • Reduce Energy Costs

Smart Meter Connectivity

  • Modbus RTU
  • Modbus TCP/IP
  • RS-485
  • Ethernet
  • Wi-Fi
  • GSM / 4G / LTE
  • MQTT
  • OPC UA
  • BACnet
  • LoRaWAN
  • NB-IoT

What is an IoT Energy Meter Management System?

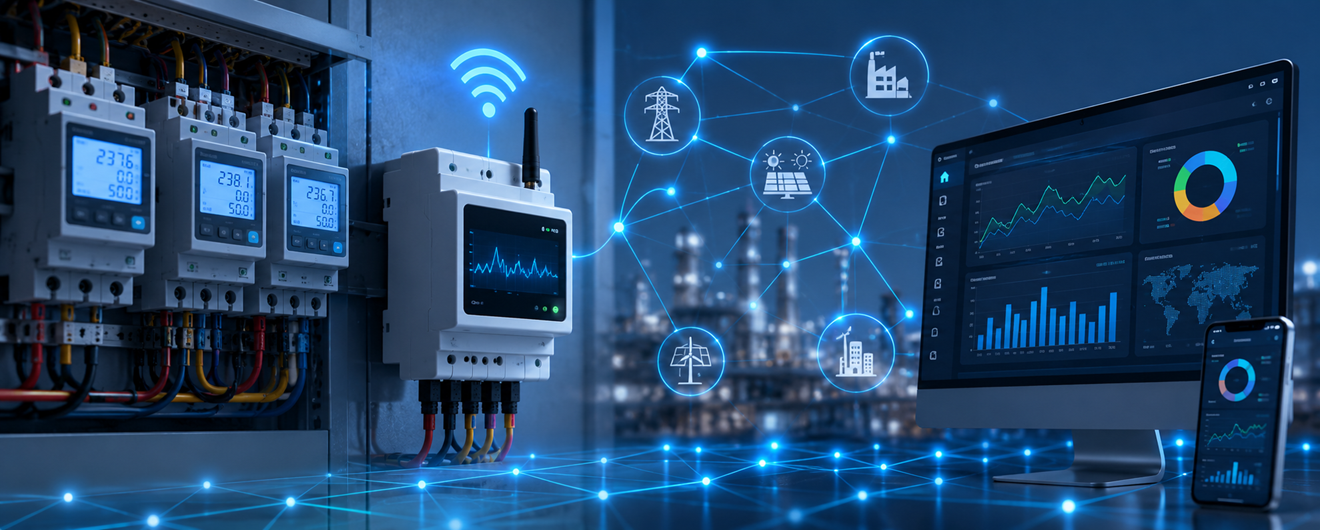
An IoT Energy Meter Management System is a cloud-enabled platform that collects real-time electrical data from smart energy meters installed across your facility. The system continuously monitors energy consumption, power quality, demand, and equipment performance, providing actionable insights to reduce energy waste and operational costs

With secure IoT connectivity, every energy meter automatically sends data to a centralized dashboard, enabling managers to monitor and control energy usage from anywhere.

Monitor every electrical parameter live.

  • Voltage (R, Y, B)
  • Current (R, Y, B)
  • Frequency
  • Power Factor
  • Active Power (kW)
  • Reactive Power (kVAR)
  • Apparent Power (kVA)
  • Energy Consumption (kWh)
  • Import / Export Energy
  • Maximum Demand (MD)
  • Total Harmonic Distortion (THD)
  • Neutral Current
  • Phase Imbalance

Plant Level.

  • Plant-wise Consumption
  • Plant-wise Cost
  • Peak Demand
  • Daily Energy Usage

Building Level

  • Office Buildings
  • Warehouses
  • Utility Buildings
  • Production Blocks

Department Level

  • Production
  • Maintenance
  • Utilities
  • Administration

Production Line Level

  • Line 1
  • Line 2
  • Line 3
  • Assembly Line
  • Injection Molding
  • CNC Shop

Machine Level

Monitor energy consumed by individual machines.

Analyze equipment efficiency.

  • Machine Running Hours
  • Idle Energy
  • Operating Energy
  • Peak Consumption
  • Load Profile
  • Start-Up Current
  • Energy per Production Cycle
  • Daily Consumption

Measure energy against production output.

  • kWh per Product
  • kWh per Batch
  • kWh per Shift
  • kWh per Machine Hour
  • Cost per Unit Produced
  • Energy per Production Order
  • Energy per Customer Order

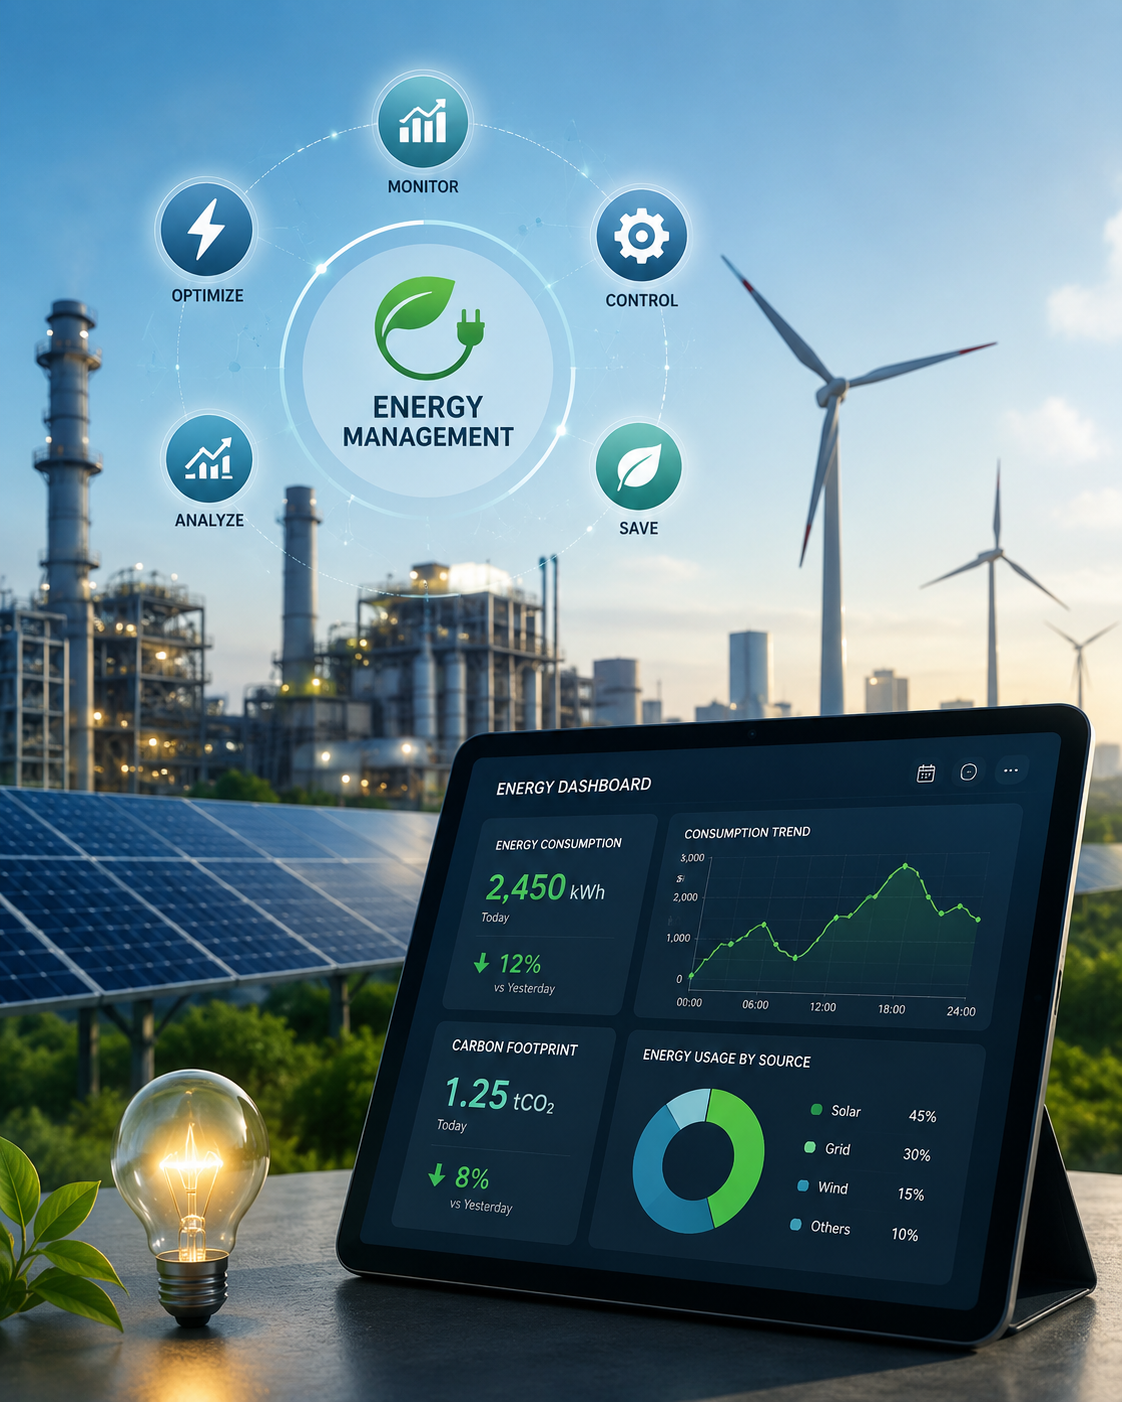
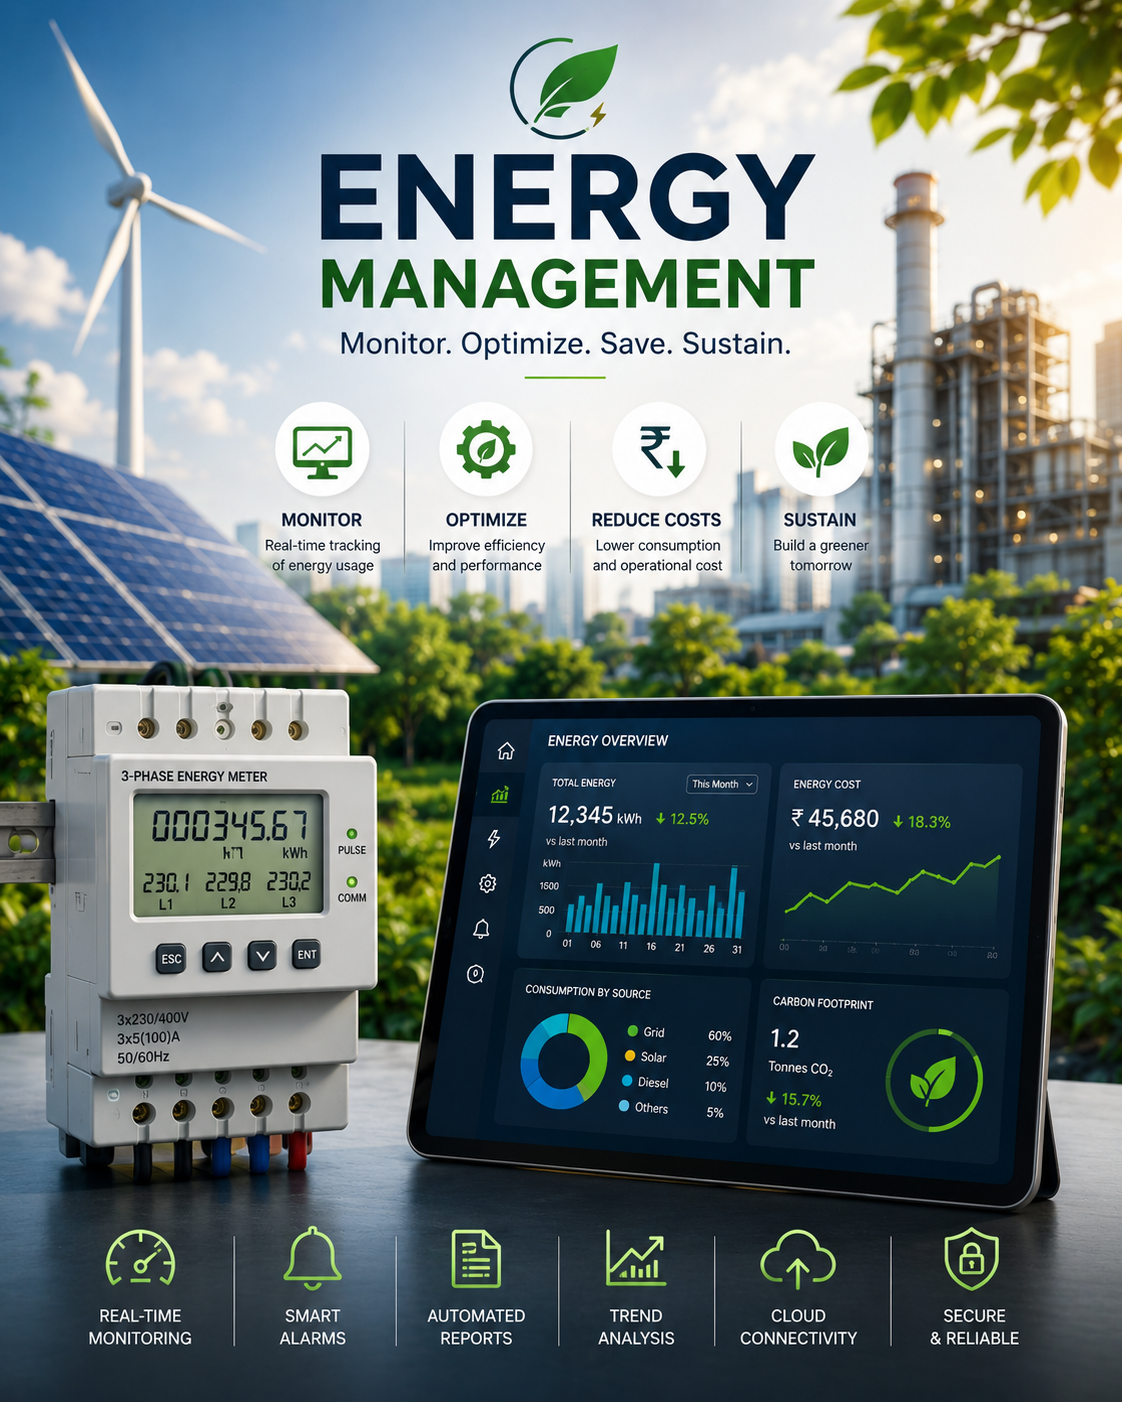
Monitor your facility from one centralized dashboard..

  • Live Energy Consumption
  • Current Demand
  • Power Factor
  • Today's Consumption
  • Today's Energy Cost
  • Monthly Energy Usage
  • Peak Demand
  • Energy Trend Graphs
  • Equipment Status
  • Utility Performance

Understand exactly where money is being spent.

  • Cost per Department
  • Cost per Machine
  • Cost per Production Line
  • Cost per Product
  • Cost per Shift
  • Cost per Plant
  • Electricity Tariff Management
  • Time-of-Day Tariff Support

Avoid expensive demand penalties.

  • Maximum Demand Tracking
  • Peak Demand Alerts
  • Load Trend Analysis
  • Historical Peak Records
  • Demand Prediction
  • Automatic Notifications

Maintain healthy electrical systems.

  • Voltage Fluctuation
  • Current Imbalance
  • Frequency Variation
  • Harmonic Distortion
  • Voltage Sags
  • Voltage Swells
  • Phase Failure
  • Phase Sequence
  • Over Voltage
  • Under Voltage

Receive instant alerts before issues become critical.

Alert Conditions:

  • High Energy Consumption
  • Low Power Factor
  • Over Current
  • Under Voltage
  • Over Voltage
  • Phase Failure
  • Communication Failure
  • Meter Offline
  • Excessive Demand
  • Harmonic Limit Exceeded

Notifications via

  • Mobile App
  • Email
  • SMS
  • WhatsApp
  • Dashboard Alerts

Compare performance over time.

  • Hourly Consumption
  • Daily Consumption
  • Weekly Trends
  • Monthly Trends
  • Yearly Comparison
  • Shift-wise Analysis
  • Seasonal Trends

Compare energy performance across.

  • Plants
  • Production Lines
  • Machines
  • Departments
  • Buildings
  • Products
  • Production Shifts

Track environmental impact alongside energy usage.

  • CO₂ Emissions
  • Carbon Footprint
  • Renewable Energy Usage
  • Energy Savings
  • Sustainability KPIs
  • ESG Reporting Support

Monitor multiple utilities from a single platform.

  • Electricity
  • Water
  • Compressed Air
  • Steam
  • Natural Gas
  • Diesel
  • LPG
  • Chilled Water

Monitor your energy usage anywhere.

  • Live Dashboard
  • Meter Status
  • Energy Graphs
  • Alarm Notifications
  • Consumption Reports
  • Energy Cost Reports
Drop Us a Line

Submit Your Enquiry

Track electricity, water, gas, steam, and utility usage from a single dashboard. Gain actionable insights to minimize waste and maximize operational performance.

Your Success Starts Here!